blog
Understanding the MySQL Query Tuning Process


Query tuning is something that a DBA does on a daily basis – analyse queries and updates, how these interact with the data and schema, and optimize for performance. This is an extremely important task as this is where database performance can be significantly improved – sometimes by orders of magnitude.
In the next few posts, we will cover the basics of query tuning – indexing, what types of queries to avoid, optimizer hints, EXPLAIN and execution plans, schema tips, and so on. We will start, though, by discussing the process of query review – how to gather data and which methods are the most efficient.
This is the ninth installment in the ‘Become a MySQL DBA’ blog series. Our previous posts in the DBA series include Configuration Tuning, Live Migration using MySQL Replication, Database Upgrades, Replication Topology Changes, Schema Changes, High Availability, Backup & Restore, Monitoring & Trending.
Data gathering
There are a couple of ways to grab information about queries that are executed on the database. MySQL itself provides three ways – general log, binlog and slow query log.
General log
General log is the least popular way as it causes significant amount of logging and has a high impact on the overall performance (Thanks to PavelK for correcting us in the comments section). It does, though, store data about queries that are being executed, together with all the needed information to assess how long a given query took.
                   40 Connect   root@localhost on sbtest
                   40 Query     set autocommit=0
                   40 Query     set session read_buffer_size=16384
                   40 Query     set global read_buffer_size=16384
                   40 Query     select count(*) from sbtest.sbtest3 where pad like '6%'
150812  7:37:42    40 Query     select count(*) from sbtest.sbtest3 where pad like '6%'
150812  7:41:45    40 Query     select count(*) from sbtest.sbtest3 where pad like '6%'
150812  7:45:46    40 Query     select count(*) from sbtest.sbtest3 where pad like '6%'
150812  7:49:56    40 Query     select count(*) from sbtest.sbtest3 where pad like '6%'
150812  7:54:08    40 Quit
Given the additional impact, the general log is not really a feasible way of collecting slow queries, but it still can be a valid source if you have it enabled for some other reason.
Binary log
Binary logs store all modifications that were executed on the database – this is used for replication or for point-in-time recovery. There’s no reason, though, why you couldn’t use this data to check the performance of the DML’s – as long as the query has been logged in the original format. This means that you should be ok for the majority of the writes as long as binlog format is set to ‘mixed’. Even better would be to use the ‘statement’ format, but it’s not recommended due to possible issues with data consistency between the nodes. The main difference between ‘statement’ and ‘mixed’ formats is that in ‘mixed’ format, all queries which might cause inconsistency will be logged in a safe, ‘row’ format. This format, though, doesn’t preserve the original query statement and so the data cannot be used for a query review.
If requirements are fulfilled, binary logs will give us enough data to work on – the exact query statement and time taken to execute it on the master. Note that this is not a very popular way of collecting the data. It has it’s own uses, though. For example, if we are concerned about the write traffic, using binary logs is a perfectly valid way of getting the data, especially if they are already enabled.
Slow query log
The slow query log is probably the most common source of information for slow queries. It was designed to log the most important information about the queries – how long they took, how many rows were scanned, how many rows were sent to the client.
Slow query log can be enabled by setting the slow_query_log variable to 1. It’s location can be set using slow_query_log_file variable. Another variable, long_query_time, sets the threshold above which queries are being logged. By default it’s 10 seconds which means queries that execute under 10 seconds will not be logged. This variable is dynamic, you can change it at any time. If you set it to 0, all queries will be logged into a slow log. It is possible to use fractions when setting long_query_time so settings like 0.1 or 0.0001 are valid ones.
What you need to remember when dealing with long_query_time is that it’s change on a global level affects only new connections. When changing it in a session, it affects the current session only (as one would expect). If you use some kind of connection pooling, this may become a significant issue. Percona Server has an additional variable, slow_query_log_use_global_control, which eliminates this drawback – it made possible to make long_query_time (and a couple of other slow log related settings that were introduced in Percona Server) truly a dynamic variable, affecting also currently open sessions.
Let’s take a look at the content of the slow query log:
# Time: 150812  8:25:19
# User@Host: root[root] @ localhost []  Id:    39
# Schema: sbtest  Last_errno: 0  Killed: 0
# Query_time: 238.396414  Lock_time: 0.000130  Rows_sent: 1  Rows_examined: 59901000  Rows_affected: 0
# Bytes_sent: 69
SET timestamp=1439367919;
select count(*) from sbtest.sbtest3 where pad like '6%';
In this entry we can see information about the time when the query was logged, the user who executed the query, thread id inside MySQL (something you’d see as Id in your processlist output), current schema, whether it failed with some error code or whether it was killed or not. Then we have the most interesting data: how long it took to execute this query, how much of this time was spent on row level locking, how many rows were sent to the client, how many rows were scanned in MySQL, how many rows were modified by the query. Finally we have info on how many bytes were sent to the client, timestamp of the time when the query was executed and the query itself.
This gives us a pretty good idea of what may be wrong with the query. Query_time is obvious – the longer a query takes to execute, the more impact on the server it will have. But there are also other clues. For example, if we see that the number of rows examined is high compared to the rows sent, it may mean that the query is not indexed properly and it’s scanning much more rows that it should be. High lock time can be a hint that we are suffering from row level locking contention. If a query had to wait some time to grab all the locks it needed, something is definitely not right. It could be that some other long running query already acquired some of the locks needed, it could be that there are long-running transactions that stay open and do not release their locks. As you can see, even such simple information may be of a great value for a DBA.
Percona Server can log some additional information into the slow query log – you can manage what’s being logged by using variable log_slow_verbosity. Below is a sample of such data:
# Time: 150812  9:41:32
# User@Host: root[root] @ localhost []  Id:    44
# Schema: sbtest  Last_errno: 0  Killed: 0
# Query_time: 239.092995  Lock_time: 0.000085  Rows_sent: 1  Rows_examined: 59901000  Rows_affected: 0
# Bytes_sent: 69  Tmp_tables: 0  Tmp_disk_tables: 0  Tmp_table_sizes: 0
# InnoDB_trx_id: 13B08
# QC_Hit: No  Full_scan: Yes  Full_join: No  Tmp_table: No  Tmp_table_on_disk: No
# Filesort: No  Filesort_on_disk: No  Merge_passes: 0
#   InnoDB_IO_r_ops: 820579  InnoDB_IO_r_bytes: 13444366336  InnoDB_IO_r_wait: 206.397731
#   InnoDB_rec_lock_wait: 0.000000  InnoDB_queue_wait: 0.000000
#   InnoDB_pages_distinct: 65314
SET timestamp=1439372492;
select count(*) from sbtest.sbtest3 where pad like '6%';
As you can see, we have all the data from the default settings and much more. We can see if a query created temporary tables, how many in total and how many of them were created on disk. We can also see the total size of those tables. This data gives us important insight – are temporary tables an issue or not? Small temporary tables may be fine, larger ones can significantly impact overall performance. Next, we see some characteristics of the query – did it use query cache, did it make a full table scan? Did it make a join without using indexes? Did it run a sort operation? Did it use disk for the sorting? How many merge passes the filesort algorithm had to do?
Next section contains information about InnoDB – how many read operations it had to do? How many bytes of data it read, how much time MySQL spend on waiting for InnoDB I/O activity, row lock acquisition or waiting in the queue to start being processed by InnoDB? We can also see the approximate number of unique pages that the query accessed. Finally, we see the timestamp and the query itself.
This additional information is useful to pinpoint the problem with a query. By looking at our example it’s clear that the query does not use any index and it makes a full table scan. By looking at the InnoDB data we can confirm that the query did a lot of I/O – it scanned ~13G of data. We can also confirm that the majority of the query execution time (239 seconds) was spent on InnoDB I/O (InnoDB_IO_r_wait – 206 seconds).
Impact of the slow log on the performance
The slow log is definitely a great way of collecting data about the performance of the queries. Unfortunately, it comes at a price – enabling slow query log enables some additional load on MySQL – a load that impacts the overall performance. We are talking here about both throughput and stability, we do not want to see drops in performance as they don’t play well with user experience and may cause some additional problems by causing temporary pileups in queries, scanned rows etc.
We’ve prepared a very simple and generic benchmark to show you the impact of the different slow log verbosity. We’ve set up a m4.xlarge instance on AWS and we used sysbench to build a single table. The workload is two threads (m4.xlarge has four cores), it’s read-only and the data set fits in the memory – we have here a very simple CPU-bound workload. Below is the exact sysbench command:
sysbench
--test=/root/sysbench/sysbench/tests/db/oltp.lua
--num-threads=2
--max-requests=0
--max-time=600
--mysql-host=localhost
--mysql-user=sbtest
--mysql-password=sbtest
--oltp-tables-count=1
--oltp-read-only=on
--oltp-index-updates=200
--oltp-non-index-updates=10
--report-interval=1
--oltp-table-size=800000
run
We used four verbosity stages for the slow log:
- disabled
- enabled, no Percona Server features
- enabled, log_slow_verbosity=’full’
- enabled, log_slow_verbosity=’full,profiling_use_getrusage,profiling’
The last one adds profiling information for a query – time spent in each of the states it went through and overall CPU time used for it. Here are the results:
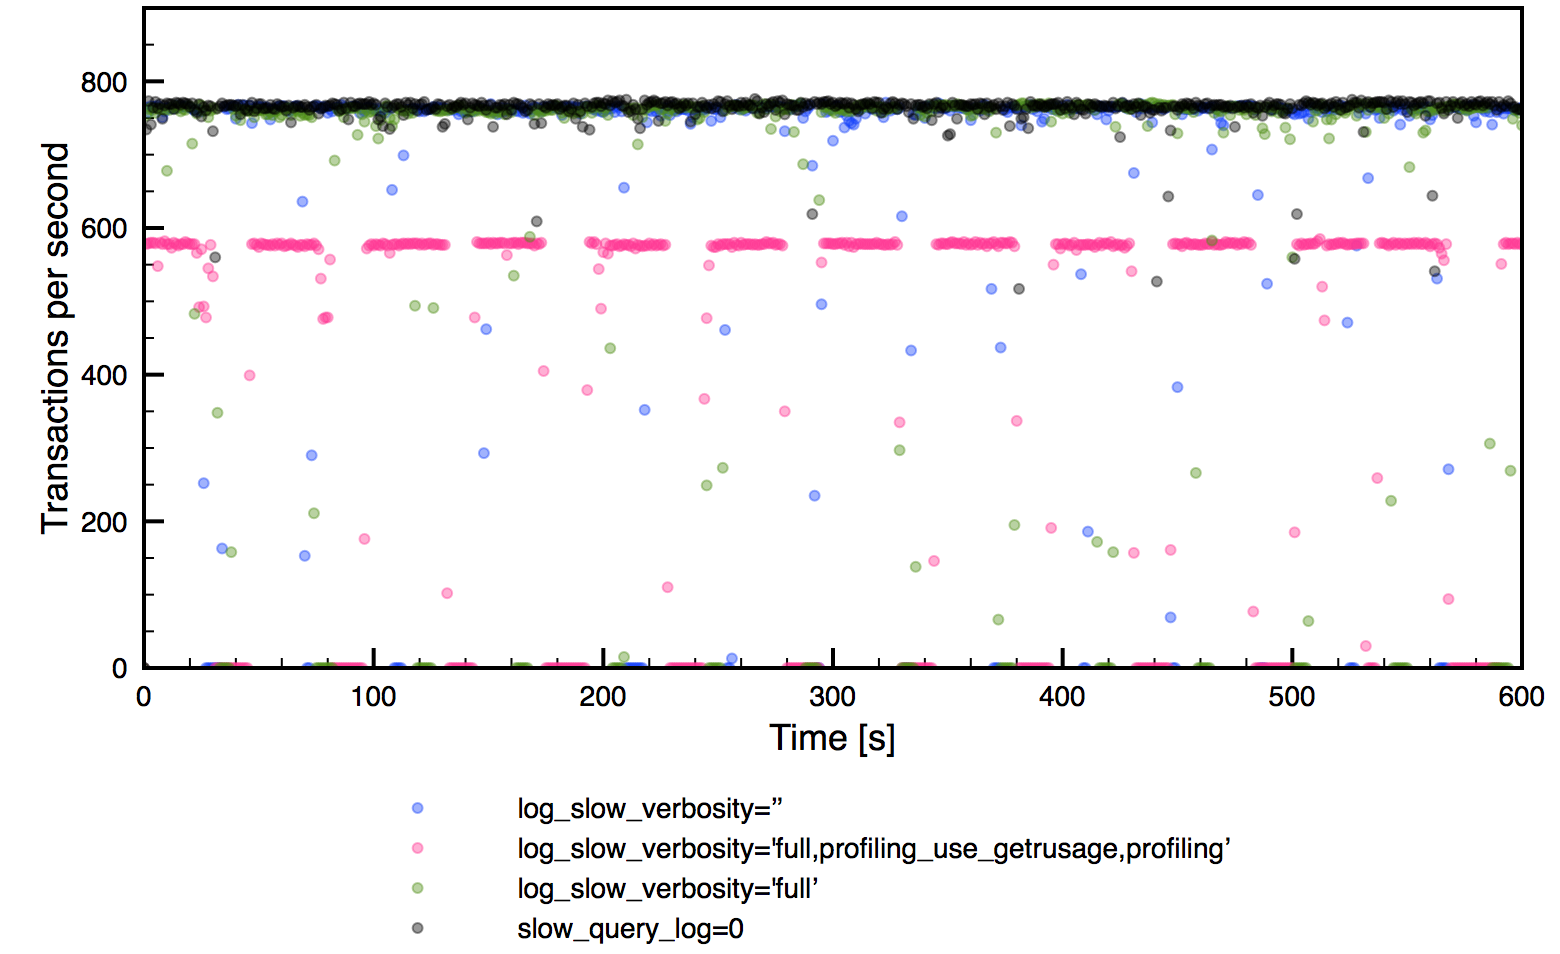
As you can see, throughput-wise, impact is not that bad, except for the most verbose option. Unfortunately, it’s not a stable throughput – as you can see there are many periods when no transaction was executed – it’s true for all runs with slow log enabled. This is a significant drawback of using slow log to collect the data – if you are ok with some impact, that’s a great tool. If not, we need to look for an alternative. Of course, this is a very generic test and your mileage may vary – impact may depends on so many factors: CPU utilization, I/O throughput, number of queries per second, exact query mix etc. If you are interested in checking the impact on your system, you need to perform tests on your own.
Using tcpdump to grab the data
As we have seen, using slow log, while allowing you to collect a great deal of information, significantly impacts the throughput of the server. That’s why yet another way of collecting the data was developed. The idea is simple – MySQL sends the data over the network so all queries are there. If you capture the traffic between the application and the MySQL server, you’ll have all the queries exchanged during that time. You know when a query started, you know when a given query finished – this allows you to calculate the query’s execution time.
Using the following command you can capture the traffic hitting port 3306 on a given host.
tcpdump -s 65535 -x -nn -q -tttt -i any -c 1000 port 3306 > mysql.tcp.txtOf course, it still causes some performance impact, let’s compare it with a clean server, no slow log enabled:
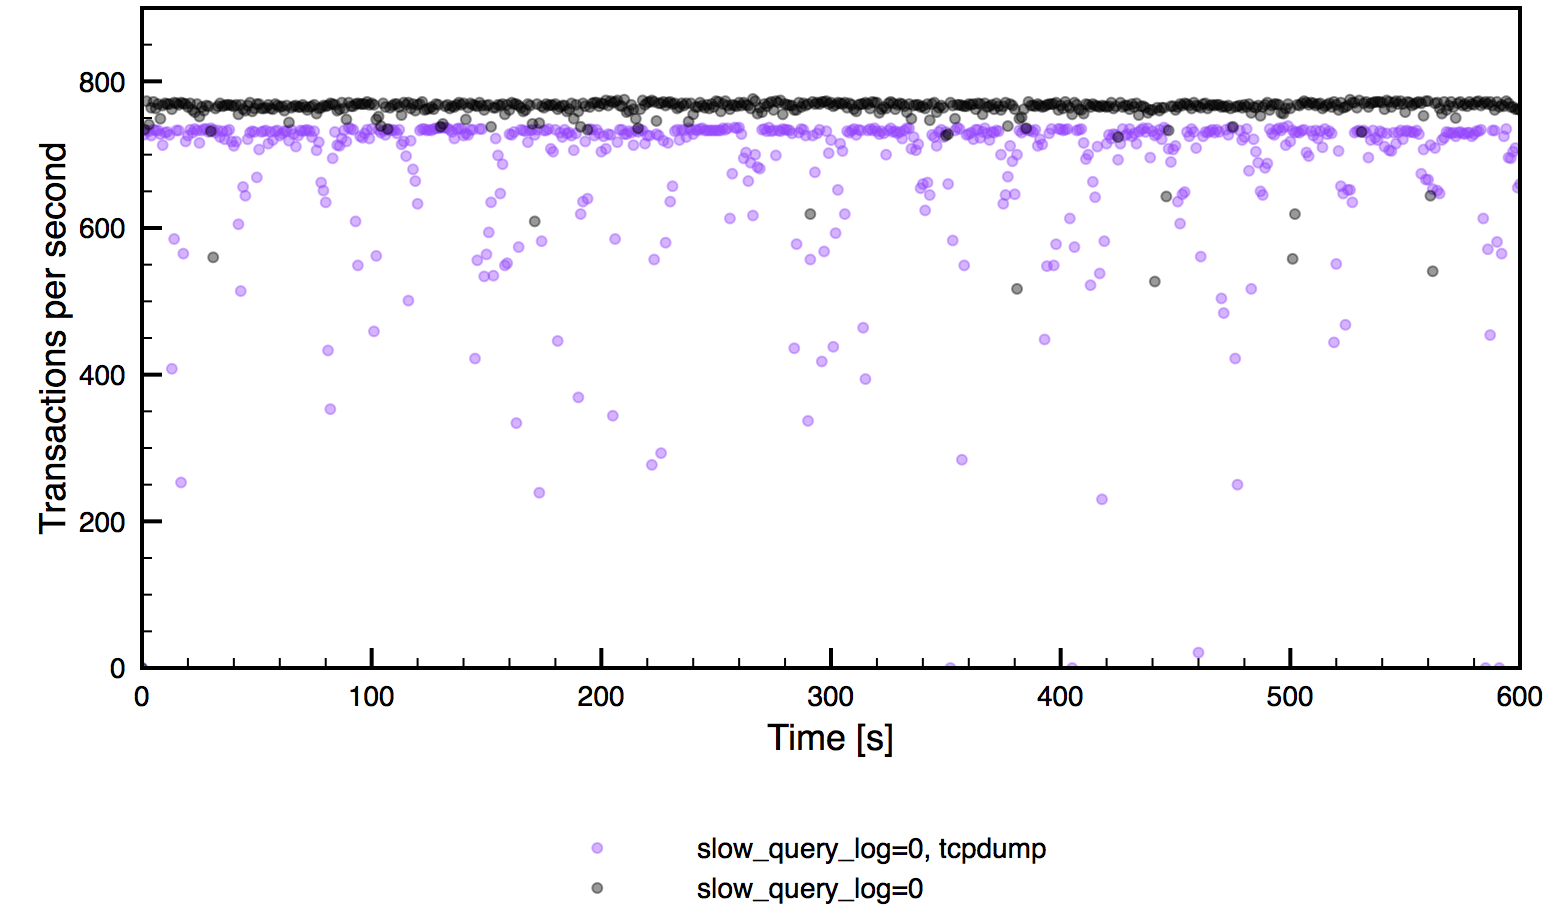
As you can see, total throughput is lower and spiky but it’s somewhat more stable than when slow log is enabled. What’s more important, tcpdump can be executed on a MySQL host but it can also be used on a proxy node (you may need to change the port in some cases), to ease the load on the MySQL node itself. In such case the performance impact will be even lower. Of course, tcpdump can’t provide you with such detailed informations as the query log does – all you can grab is a query itself and amount of data sent from the server to the client. There’s no info about rows scanned or sent, there’s no info if a query created a temporary table or not, nothing – just the execution time and query size.
Given the fact that both main methods, slow log and tcpdump, have their pros and cons, it’s common to combine them. You can use long_query_time to filter out most of the queries and log only the slowest ones. You can use tcpdump to collect the data on a regular basis (or even all the time) and use slow log in some particular cases, if you find an intriguing query. You can use data from the slow log only for thorough query reviews that happen couple of times during a year and stick to tcpdump on a daily basis. Those two methods complement each other and it’s up to a DBA to decide how to use them.
Once we have data captured using any of the methods described in this blog post, we need to process it. While data in the log files can be easily read by a human, and also it’s not a rocket science to print and parse data captured by a tcpdump, it’s not really the way you’d like to approach the query review – it’s definitely too hard to get the total picture and there’s too much noise. You need something that will aggregate information you collected and present you a nice summary. We’ll discuss such a tool in next post in this series.