blog
SQL Load Balancing Benchmark – Comparing Performance of MaxScale vs HAProxy

In a previous post, we gave you a quick overview of the MaxScale load balancer and walked through installation and configuration. We did some quick benchmarks using sysbench, a system performance benchmark that supports testing CPU, memory, IO, mutex and also MySQL performance. We will be sharing the results in this blog post.
![]()
Sysbench setup
For our tests we used the latest version of sysbench, straight from bzr. Installation is simple. First, make sure you have all the prerequisites. For Ubuntu these are: libmysqlclient-dev (or equivalent), bzr, automake, make, libtool and libssl-dev.
Get the code and compile it:
$ cd /root
$ bzr branch lp:sysbench
$ cd /root/sysbench
$ ./autogen.sh
$ ./configure
$ make
$ make install
The next step was to prepare database for a benchmark. We created the ‘sbtest’ schema and granted access to it to the ‘sbtest’ user with a correct password. After that, populate the database using the following command:
$ sysbench
--test=/root/sysbench/sysbench/tests/db/oltp.lua
--mysql-host=10.69.179.54
--mysql-port=3307
--mysql-user=sbtest
--mysql-password=sbtest
--oltp-tables-count=128
--oltp-table-size=400000
prepare
Once complete, it is time for some benchmarking.
Performance benchmarks
We were interested mostly in the proxy’s throughput thus we executed a series of read-only sysbench OLTP tests. The exact command looked as below:
$ sysbench
--test=/root/sysbench/sysbench/tests/db/oltp.lua
--num-threads=512
--max-requests=0
--max-time=600
--mysql-host=10.69.179.54
--mysql-port=3307
--mysql-user=sbtest
--mysql-password=sbtest
--oltp-tables-count=128
--oltp-read-only=on
--oltp-skip-trx=on
--report-interval=1
--oltp-table-size=400000
run
Now, one of the gotchas we ran into while evaluating MaxScale – when using RW service, is that all reads headed directly to the ‘Master’. After some head scratching, we found that, by default, sysbench uses explicit transactions (see –oltp-skip-trx=on in the sysbench command above). MaxScale implements read/write split in a way that may be slightly misleading before you get used to it – reads are split across “slave” nodes, but there are some exceptions. One of them are transactions that are started explicitly – if your app executes queries using BEGIN; … ; COMMIT; , then all such queries will be routed to the single ‘Master’ instance. As a result, we had to add –oltp-skip-trx=on flag to the sysbench program to make sure reads will be split onto the slaves.
Let’s take a look at the results. Hardware-wise, we’ve been using r3.4xlarge EC2 instances for a proxy/sysbench node and three r3.2xlarge EC2 instances for Galera nodes. Workload was in-memory, CPU bound. Thanks to scalability improvements in MySQL 5.6, we were able to fully saturate all 8 CPU cores on an instance when running sysbench directly against a node – this confirmed that results won’t be skewed by MySQL’s scalability limitations.
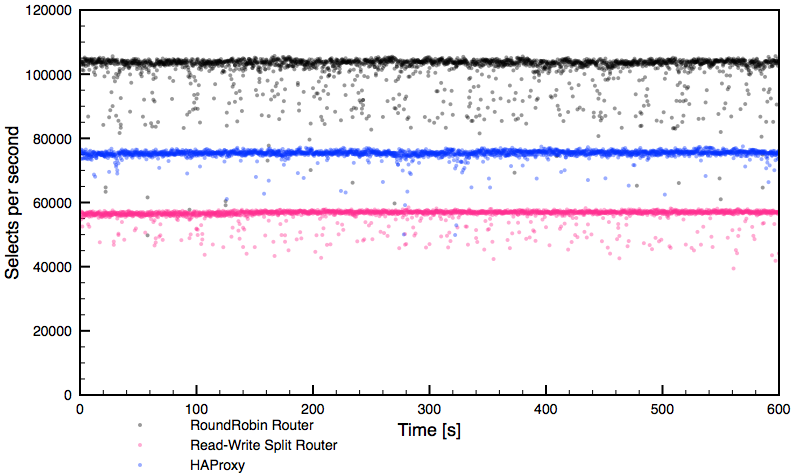
As can be seen, each routing method provided fairly stable performance with occasional drops. What’s important to clarify – HAProxy fully saturated one CPU core so this level of performance, around 75k selects per second, is the maximum we can get from this proxy under the test workload.
On the other hand, the round-robin MaxScale router hit contention of some kind outside of the proxy itself – neither network nor CPU were saturated on the proxy or the Galera nodes. We were not able to push through this level of performance. While performing a sanity check using direct connections to Galera, bypassing the proxy, we were only able to reach the same level of performance, confirming it is something outside of MaxScale. We did not investigate further, AWS is a bit too black-boxish for that and it wasn’t really necessary. The total theoretical throughput of the system under our workload was ~135 – 140k selects per second (two nodes with 100% CPU utilization, delivered ~90-95k selects per second).
The read-write split router performed around ~57k of selects per second, saturating four cores – MaxScale was configured to use four threads. Having seen that, we repeated the benchmark allowing MaxScale to use 12 threads. Here are results:
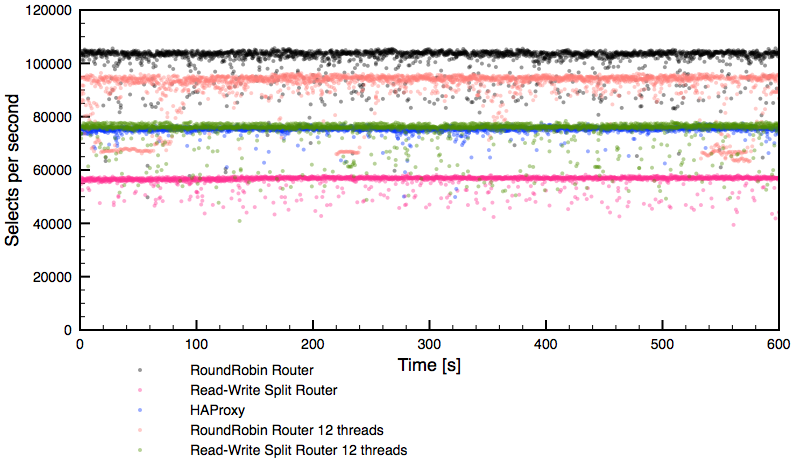
We can see that read-write split router (green dots) bypassed HAProxy’s performance (blue dots). What we can’t see on the graph, but it was captured by us during the benchmark, was that MaxScale used almost nine CPU cores to get there:
   PID USER      PR  NI    VIRT    RES    SHR S  %CPU %MEM     TIME+ COMMAND
 31612 root      20   0 1389876  62860   4392 R 877.2  0.0 339:53.56 maxscale
 34485 root      20   0 8435680  48384   1640 S 317.8  0.0  28:46.06 sysbench
R3.4xlarge has 16 virtual cores so there was still room for growth. It seems like this was a maximum possible throughput under our conditions.
What’s interesting is that the round-robin like setup, using readconnroute router, performed worse while having 12 threads (versus when we had 4 threads) enabled in MaxScale’s configuration. After a short investigation, we could see an internal contention on mspin_lock which decreased the performance. What else we can see? Readconnroute router definitely had issues with maintaining stable performance – drops are noticeable and long-running.
Response time results
Let’s check the response time graphs. Below, you can see a global overview followed by a zoom into the 0 – 300ms region.
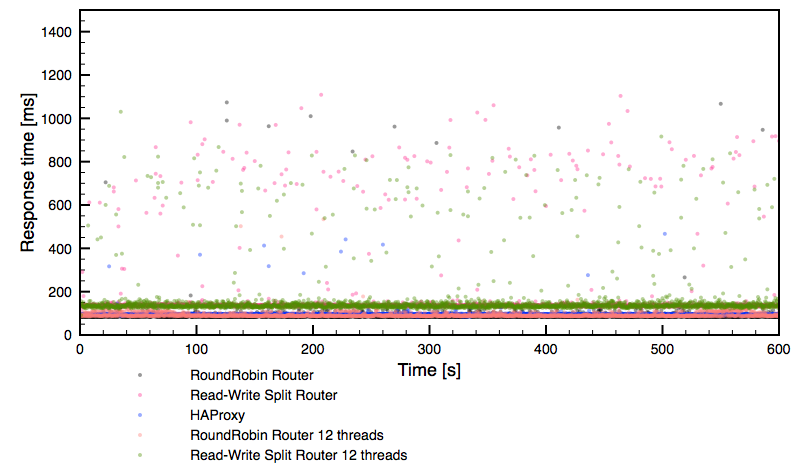
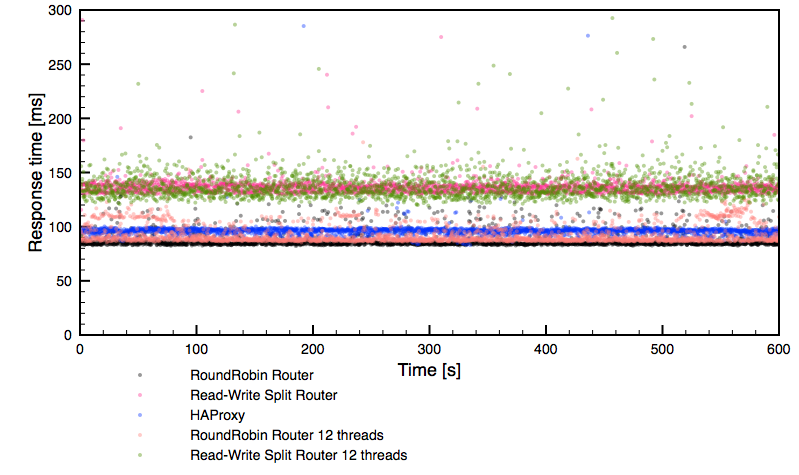
Rather expected results, in line with the performance we have seen in earlier graphs. It’s worth noticing though that both 12 thread configurations delivered much less stable performance than the rest of the setups tested.
Conclusions
Let’s try to draw some conclusions from the data. First, MaxScale allows you to implement read/write split without the need to redesign your application. All you need to do is to setup MaxScale with the correct configuration (readwritesplit router). At least, that’s the theory. In practice, your application cannot use explicit transactions (which is not that big limitation per se, but if you do use them, you will not be able to benefit from RW split in an easy way). There are some other gotchas regarding the use of user-defined variables in queries. Those are pretty valid limitations, which are totally understandable, but it has to be said that one can’t expect that RW split in MaxScale will work in all of the cases. You should take some time to read MaxScale’s documentation to familiarize with any other limitations which may affect your particular workload.
Second, MaxScale RW split, while it was able to bypass HAProxy by a small margin in terms of the performance, required significant CPU resources to get there (9 cores compared to HAProxy’s single core) and its performance was not as stable as HAProxy’s. It’s obviously caused by the additional logic needed for a RW split (a MaxScale configuration similar to HAProxy, round-robin, delivered much higher performance than HAProxy and comparable in the stability) but it makes this setup not necessarily the best option to use in all cases.
Taking it all under consideration, we’d say that, for now at least, if you have the possibility of performing a RW split on the application side, you might want to consider it – setup two listeners in the way we did it in this test. Use readconnroute router for reads and readwritesplit router for writes. In that way you’ll be able to read from all nodes of the cluster while writing only to one of them, to minimize chances of deadlocks in Galera. If your application does not allow you to do that, you can still use readwritesplit router to get a RW split even when it results in additional CPU utilization on the proxy’s node. It’s great to have this option even if it comes with a reduced overall performance.
Having said that, the workload that we tested was designed to stress a proxy – it’s very unlikely that your application will want to execute 75k selects per second. Heavier queries will take longer time and total throughput will be much lower. You can also be less CPU-bound but more I/O-bound – usually databases do not fit entirely in the InnoDB buffer pool. In such cases you may never notice the performance limits of the MaxScale readwritesplit router. As usual, it’s all about performing tests and checking what works best in your environment.
Last but not least, MaxScale is still a pretty new software and we’d expect it to mature with every release, adding new options and removing design and scalability limitations. It’s definitely nice to have more options when it comes to proxies, especially when the proxy is database-centric.